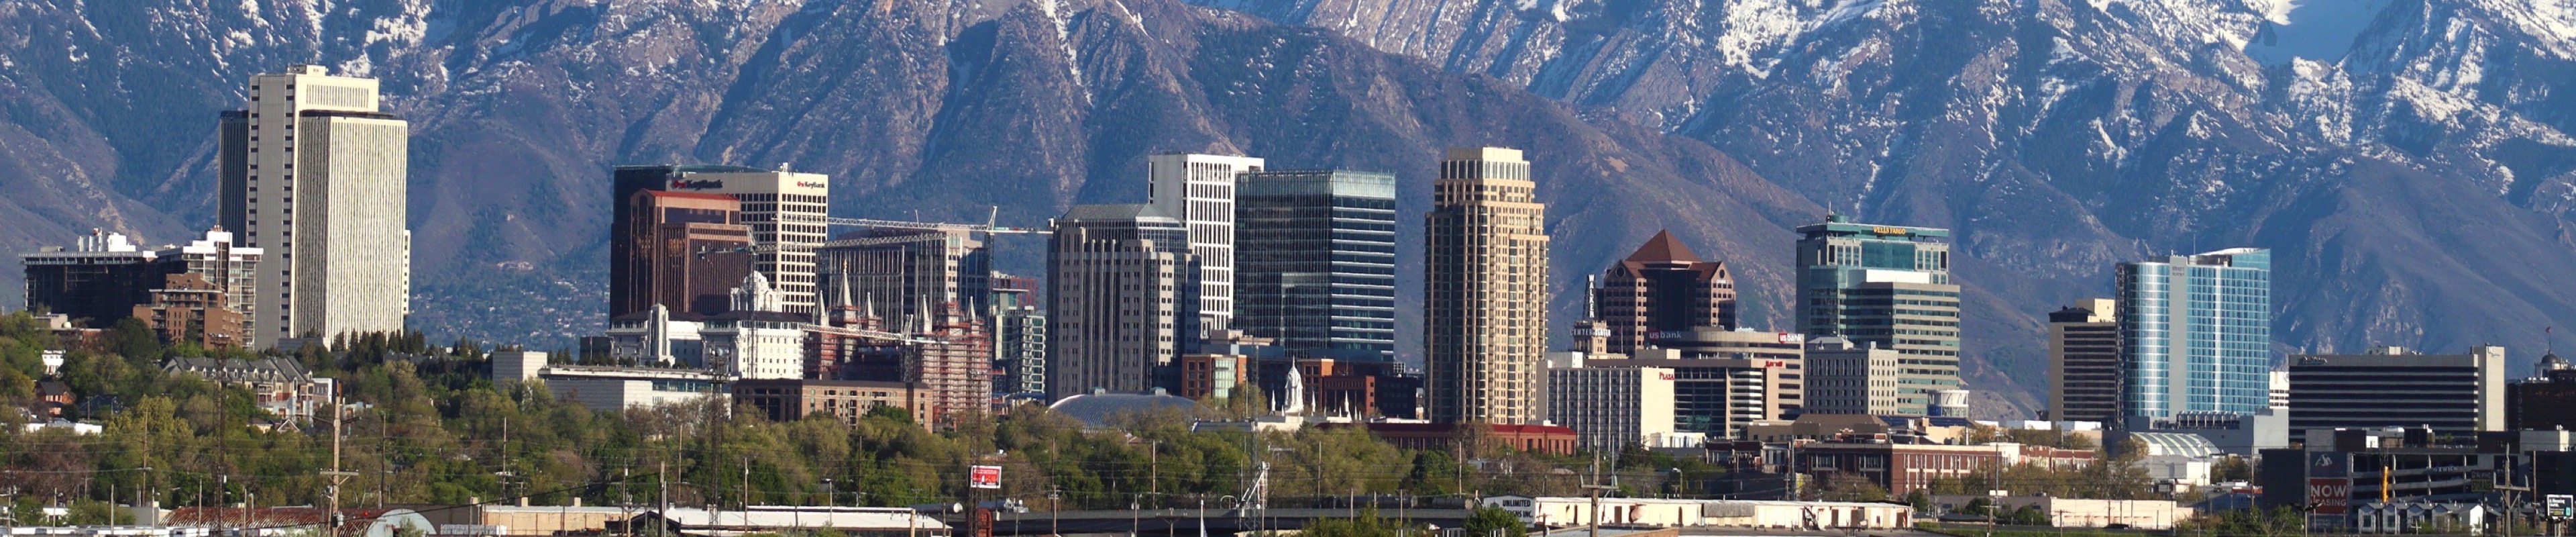
Salt Lake City, UT industrial market
The Salt Lake City industrial market is stabilizing after a post-2021 construction surge pushed vacancy from near 1.5% to roughly 5-8% by 2025-2026. Leasing activity improved in Q1 2026 with net absorption reaching a six-quarter high, while new groundbreakings remain near historic lows, which should gradually tighten available supply. Asking NNN rents held in the $0.81-0.87/SF/month range through early 2026, and sale prices for large bulk-distribution assets are trading in the $109-$118/SF range for arm's-length transactions, with smaller owner-user product trading considerably higher on a per-SF basis. The Northwest Quadrant and Southwest submarkets continue to dominate leasing volume, and industrial outdoor storage (IOS) sites are in particularly strong demand given land scarcity.
What's driving Industrial prices in Salt Lake City
Sale prices for stabilized, NNN-leased Class A warehouse assets in the Salt Lake City market held in the $109-$118/SF range for large bulk product through mid-2025 to Q4 2025, roughly flat from prior-year levels, while smaller owner-user buildings trade at a significant premium of $250-$338/SF on current listing platforms.
- Bulk-distribution vacancy elevated at 12.4% in Q1 2026 due to 8.5 MSF of new deliveries since early 2024, pressuring rents and values on large-bay product
- New groundbreakings near historic lows since Q3 2024, limiting future supply and setting up a tightening cycle for non-bulk product (vacancy only 2.5%)
- Industrial outdoor storage (IOS) sites commanding premium pricing as developable land in Salt Lake County becomes increasingly scarce
- 2032 Winter Olympics infrastructure investment and strong Wasatch Front population growth sustaining long-term occupier demand
Market intelligence
Tracking this market · 7 comps · latest deal Mar 2026.
This quarter: 0 comps added to our corpus in Q4 2026. Trend medians use closed-deal dates from our growing comp corpus; automated estimates, not an appraisal.
Where these comps are
Pins are geocoded from each comp's public address, so positions are approximate. Comps quoted at the submarket level aren't pinned.
Recent Industrial comps in Salt Lake City, UT
| Address | Date | Type | Size (SF) | Price / Rate | $/SF |
|---|---|---|---|---|---|
| Multiple listings, Glendale/West SLC submarket, Salt Lake City, UT listing | Jul 2026 | Lease | $10.44-$12.00/SF/yr NNN | $10.44-$12.00/SF/yr NNN | |
| 6020 W. 300 South, Salt Lake City, UT 84104 news | Mar 2026 | Sale | 833000 | $145,440,000 | $174/SF |
| Undisclosed (West Jordan, UT - adjacent Salt Lake County submarket) news | Q4 2025 | Sale | 1000000 | $120,500,000 | $118/SF |
| 5552 W. 700 South (City Creek Industrial - Building G), Salt Lake City, UT 84104 news | Q4 2025 | Lease | 545000 | ~$0.87/SF/mo NNN (market asking rate per Colliers Q1 2026) | ~$10.44/SF/yr NNN |
| Undisclosed (~Northwest Quadrant, Salt Lake City, UT) news | Jun 2025 | Sale | 1000000 | $112,000,000 | $109/SF |
| 3175 W. 500 South (5 South Commerce Center), Salt Lake City, UT 84104 news | Dec 2024 | Sale | 172847 | Undisclosed (Utah non-disclosure state) | |
| 3255 W. 500 South, Salt Lake City, UT 84104 news | Dec 2024 | Sale | 40709 | Undisclosed (Utah non-disclosure state) | |
| Median of 3 recent sales · $118/SF | $118 | ||||
No comps in this filter.
What's your industrial property worth?
Get a free, instant estimate from recent comps, with the source cited on every one.
No specific address? Explore Salt Lake City industrial properties →
Other markets
Figures are automated estimates derived from public listings, records, and brokerage announcements for Salt Lake City, UT, not an appraisal or a broker opinion of value. Verify independently before relying on them. CompNinja connects owners with licensed local brokers; it is not a brokerage.